

FLorida Maps (FANGAP)
Florida Neighborhoods Geospatial Project (FANGAP) provides neighborhood maps and measures generated from Dr. Lilah Besser’s research studies on neighborhood built and social environments and brain health. If you would like to use these measures for research or other purposes, please contact us.
Greenspace Measures
Percentage total green space
Percentage forest
Percentage open space
Normalized Difference Vegetation Index (NDVI)
Percentage park space
Percentage tree canopy cover (USFS)
Other Measures
Land surface temperature (LST)
Number of social destinations
Number of shopping destinations
Number of dining destinations
Number of grocery stores/supermarkets
Number of health facilities
Accessible blue space
Intersection density
FANGAP measures documentation
Details on the data sources, years of data, and methods to create the FANGAP measures can be found in the FANGAP Data Dictionary.
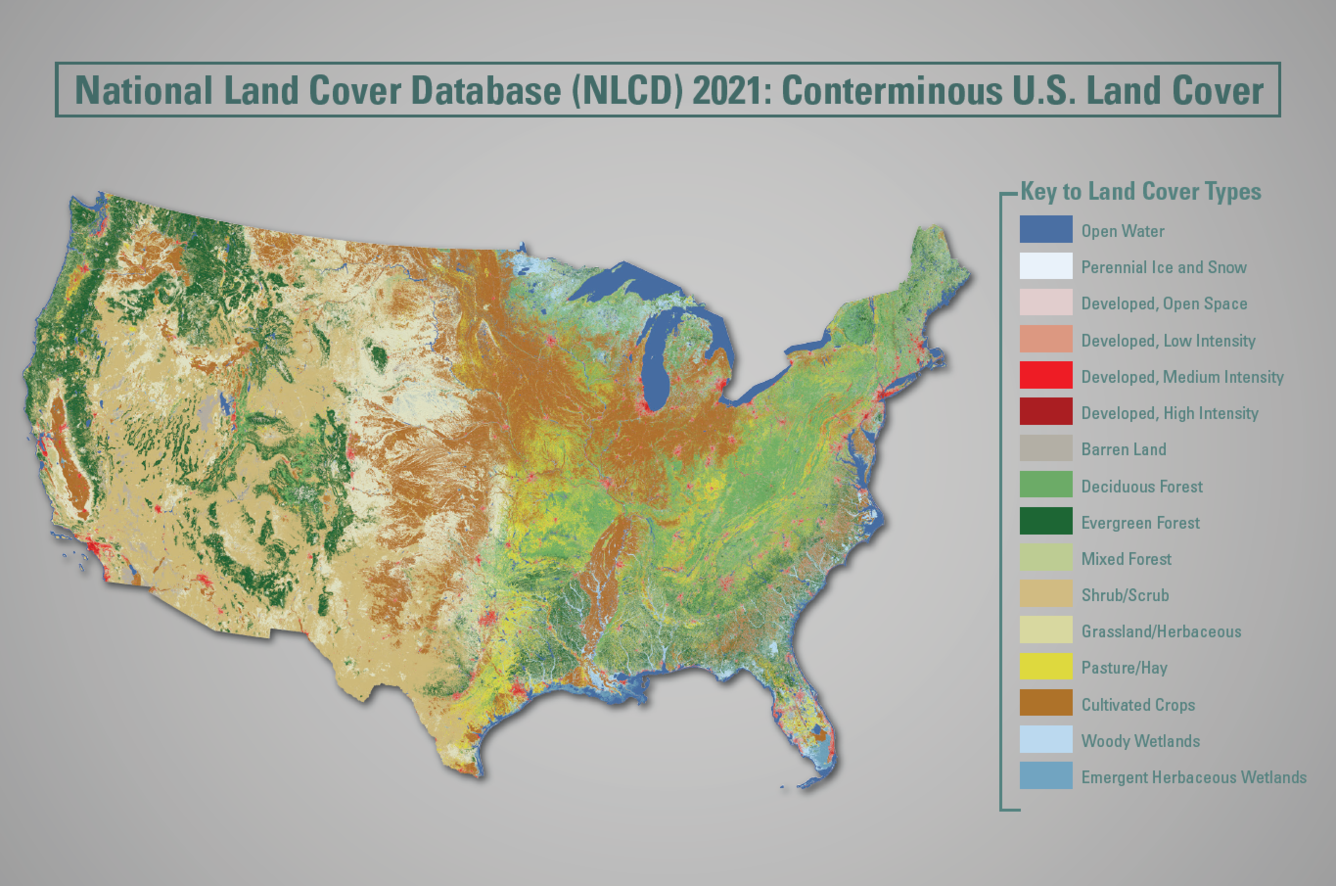
Greenspace
The NLCD is compiled by a consortium, including the U.S. Geological Survey, the National Oceanic and Atmospheric Administration, and the U.S. Environmental Protection Agency. We classified and grouped land cover classifications to categorize greenspace into 3 categories: total greenspace, forest, and open space.

Land Surface Temperature
Land surface temperature (LST) describes how hot or cold the ground would be in a particular location. LST is calculated from data derived from the U.S. Geological Survey and Landsat 8/9 imagery. LST can be used to identify urban heat islands, an effect where developed and urban areas experience higher than average temperatures. We have estimated the mean LST value for each Census tract.
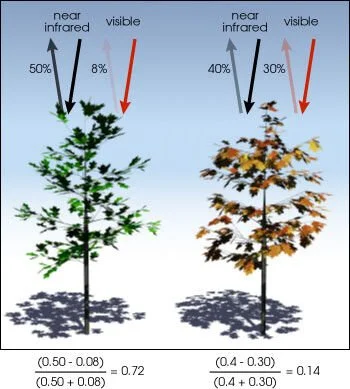
Normalized Difference Vegetation Index (NDVI)
NDVI is a widely-used measure that estimates greenness and vegetation density. It is calculated from the spectrometric data bands (red and near-infrared) from satellite imagery such as Landsat 8/9. We have estimated the mean NDVI value for each Census tract using Landsat 8 imagery from the USGS Earth Explorer API.

Park Space
Our park space measure includes the total number of national, state, federal, city, and local parks within a Census tract. Our lab is interested in understanding how social factors impact access to park spaces and how these inequities translate into differences in brain health. Our park space measures are derived from the official Esri website and the FGDL database.
BLUE SPACE
Blue space comprises surface water bodies and water courses such as oceans, lakes, rivers, basins, wetlands, and streams. We used data from the Florida Fish and Wildlife wetlands dataset to derive blue space measures for Florida Census tracts.

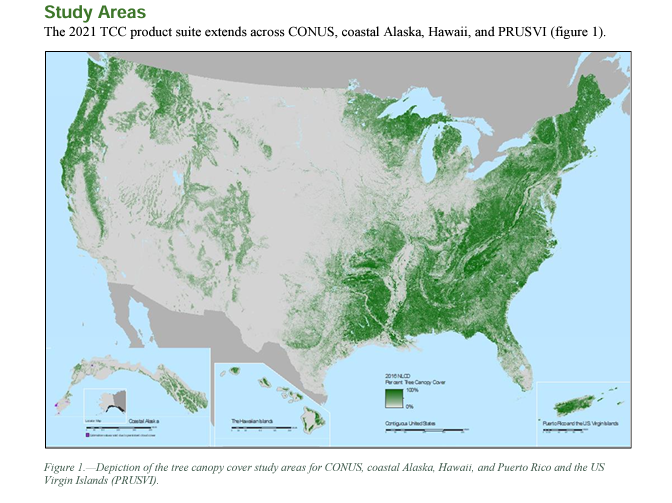
Tree Canopy Cover
Tree canopy cover is another metric derived from satellite imagery that characterizes greenspace of a specified area. It represents the amount of leaves, shrubbery, branches, and foliage covering the ground. The raster layer is downloaded from the USDA website and is distributed by the U.S. Forest Service.

intersection density
Measures of intersection density (intersections/square mile) for each Florida Census tract were derived using data from the Environmental Protection Agency. Intersections that did not allow for pedestrian passage were excluded. Higher intersection density is typically correlated with increased street connectivity and walkability.

land use (Parcels)
We use data on parcels (pieces of property or land) including their size and land use type to characterize neighborhood resources and destinations (i.e., shopping, social destinations, dining, grocery/supermarkets, health facilities) at the Census tract level. Parcel data for Florida are downloaded from the FGDL database.